Archive
On Donald Trump, Part One
Donald Trump is an objectively bad president.
What I mean by that is that regardless of your ideology, regardless of your views on his policy positions, and regardless of party affiliation, Donald Trump is measurably bad at the job of being president. We all know the reasons why liberals don’t like Trump–they say he’s mean, has a racist track record, is bad for the environment, is divisive, ect.
As the primary opposition to Trump, these rationales get a lot of press and attention. But for many people, these sorts of “personality” or “professionalism” reasons aren’t actually important to the job of being president. For some other people, supporting whatever it is that liberals oppose so vigorously brings satisfaction on its own; if liberals are viewed as over-sensitive, entitled, exhausting semi-socialists, why would anyone want to be on their side?
In three parts, I intend to outline why–even if the above things don’t matter to you and even if you actually like the vision of America that Donald Trump is attempting to build–he is ineffective at best, and he does not deserve public support.
Part One: The Economy
The economy is a strange place to start with a critique of Donald Trump. It is unquestionably the strength of his administration, as the general public is well aware. And I will in no way attempt to deny that the economy under Trump has gone pretty well. The reason I want to address this is because many supporters of Trump fall back on the old political nugget of wisdom that “it’s the economy, stupid” and think that good economic conditions are reason enough to excuse any and all other shortcomings the president may have.
But the economy is not performing notably better than under past presidents, and there are many causes for concern within the numbers. If the economy is doing well, but nowhere close to oft-repeated claim that it is maybe “the greatest economy in our history,” then the rationale for excusing other shortcomings falls apart. A series of very basic economic charts and discussions will show, clearly and easily, that Trump has not been any sort of savior for the economy. To reduce any chance of bias, I will use raw data and link to specific reports, rather than to articles or columns describing these numbers as often as possible.
1. Interest rates
I’m not going to waste much time on this. As a clear-cut, baseline fact, when the economy is doing “great” or even “well,” there is no need to beg the Federal Reserve to slash interest rates. Period. If the economy is doing great, or even well, there is no need for the Federal Reserve to cut interest rates (as they have for the first time in a decade, and are expected to do again this year). If the economy is going great, or even well, then it would do so even with higher interest rates–and rates are still fairly low by historical standards.
If you’re thinking, “the Federal Reserve only had to lower rates because they had raised them too high, too fast,” here is a graph of the effective federal funds rate over the past four presidencies (Trump, Obama, Bush, and Clinton).
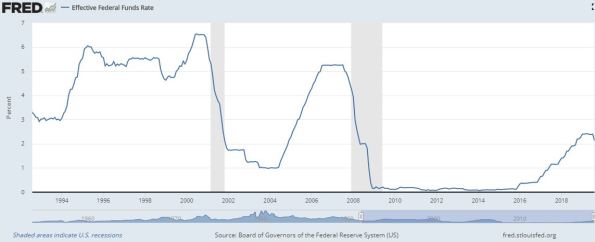
Topping out at slightly over 2%, the interest rates under Trump remain lower than they were through the Clinton years and through many of the Bush years. It is also notable that the federal funds rate has increased more slowly in this recovery than in past recoveries. This is a small point, but simply counters the notion that the Federal Reserve has created strong headwinds for the Trump economy.
2. Jobs Jobs Jobs
The biggest claim to fame for the Trump economy are the record-low unemployment numbers. Having a tighter labor market is great for economies because it generally leads to higher wages (more on that later). But the unemployment rate is simply a function of job growth, which is tracked monthly. And if you want to see signs of an economy heating up, or to attribute the low unemployment to a specific event or time period, you would expect to see monthly job growth increasing.
A chart of the average monthly job growth, by year, over the past four presidencies shows very clearly that there is no upward trend in job growth under the Trump administration. In fact, 2019 job growth is undeniably slowing down, currently on track to finish the year with the lowest average monthly job growth since 2010.
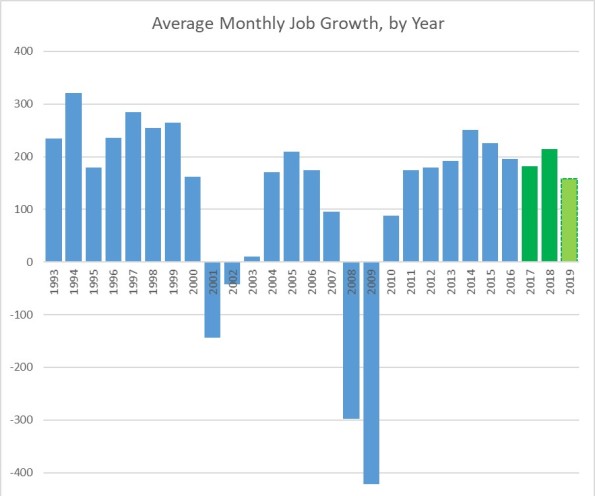
Source: Bureau of Labor Statistics
3. Gross Domestic Product (GDP)
There was a lot of talk from the Trump campaign team and Trump administration about “returning” to 3% annual GDP growth and exceeding that mark. This talk was not only a campaign promise, but a big rationale for passing the tax cuts at the end of 2017. Trump was very excited when the initial estimates for 2018 GDP growth came in at 3.0%, but was quieter when they were revised down to 2.9%. By any measure, the 2017 and 2018 GDP growth look wholly unremarkable when compared to any long term view, and things are only slowing down in 2019.

Source: St Louis Federal Reserve
As shown, 2017 and 2018 are almost identical to 2014 and 2015, and the 2016 slowdown that followed those two years looks likely to be repeated in 2019, as the first two quarters came in at 3.1% and 2.0%, with the New York Federal Reserve’s Nowcast and the Atlanta Federal Reserve’s GDPNow forecast both currently estimate the third quarter to come in around 1.5%.
4. The Stock Market
Trump has been good for the stock market, overall; there’s no denying that. When you promise and then pass a giant corporate tax cut, it is going to be good for corporations and thus, the stock market. And after a fairly sluggish two years (2015 and 2016), the election of Trump led to a swift uptick based on business-friendly expectations, which lasted straight through January of 2018 (a month after the tax bill was, indeed, actually passed and signed into law).
However, since that peak after the tax cut, rather than see continued increases as the impacts of the tax bill filtered through the economy, the stock market has been basically flat for the past year and a half. Volatile, yes, but rarely has it exceeded the peak from late January, 2018. This stagnation in the market has left Trump’s total impact on the market over the course of his presidency thus far positive, but not particularly more positive than it was under Obama–and certainly not as good as it was under Clinton.
Below is a chart highlighting the relatively flat 2015 and 2016, the sharp uptick upon the election of Trump (November 2016 through January 2018) and then the flat performance over the past year and a half.

5. Wages
As mentioned in item 2, a tighter labor market is supposed to be really good for wage growth. In the basic law of supply and demand, a greater demand for jobs (job growth) with a smaller supply of available labor (low unemployment), should lead to higher labor prices. As monthly job growth was positive for a record number of months under Obama and then Trump, wage growth remained stubbornly low. As the unemployment rate crept lower, the expectation was that eventually, wage growth would catch up; and to an extent, that happened. Yes, under Trump, wage growth has finally improved. However, the chart below again illustrates that these improved numbers still pale in comparison to strong economies of the past, and haven’t caught up to pre-recession wage growth yet.
![]()
There’s nothing wrong with 3.0-3.9% wage growth, but given the remaining economic fundamentals, there is a reasonable expectation that wage growth is still lagging. To remain objective and simple, we won’t go into the theoretical explanations for what is holding wages back, as it remains an unanswered question about which explanations are highly varied. But the fact remains that wage growth is still well lower than it was throughout the Clinton and Bush years.
Summary Thus Far
Combined, these first five points show very clearly that the “Trump economy” is rather run-of-the-mill compared to recent history. There is nothing particularly “great,” let alone historically-great about current conditions. So using the economy as an excuse for other shortcomings is already less appealing. This becomes even more true once there is an examination of the potential indicators of economic trouble that are already popping up, which follow.
1. The Yield Curve
Another short, obvious point to start things off. In the past 50 years, the return on 10-year treasuries has fallen below the return on 2-year treasuries seven times. All seven times, a recession has followed within 19 months. The yield curve has inverted again. Many people claim that this time is different, and there are merits to those claims, but attempting to talk your way out of an economic indicator that has a perfect record isn’t the strongest position to argue from.
2. Debt
When attributing credit and blame to presidents for economic conditions, it’s important to tie the attributions to specific events. Presidents and congress have limited tools to impact the economy, but one big tool is fiscal policy. In that respect, Trump has presided over a very large fiscal stimulus–increasing government spending while decreasing government revenues. This is similar to some of the tactics used by Bush and Obama in the wake of the financial crisis, though slightly smaller in scale.
The charts below show that the deficit has increased by a large amount in each of the past two years under Trump after declining in 6 of the previous 7 years (all under Obama). It also shows that the deficit increases have been driven by both spending and revenue effects. Often, tax cuts reduce the expected revenues when compared to the projections of what would have been collected absent those cuts, but revenues still increase year-over-year because the economy is growing. In this case, revenue collection in 2018 (the first year of the tax cuts) was actually lower than revenue collection in 2017.
The takeaway here is that the government borrowed extra money in order to stimulate economic growth. And as shown in the first segment of this piece, that stimulus didn’t particularly work; growth did not improve to the levels the administration sought, job creation did not improve, and wages remained underwhelming.
But that’s not the only debt issue with the current economic conditions. The economy is approximately 70% consumer-driven. And a decade of low interest rates has incentivized borrowing, leading to record-high consumer debt levels.
Granted, due to continued growth and inflation, any cumulative measure is often at it’s all-time high. To get a feel for how problematic this debt is, you can look at consumer delinquency data. The delinquency rate has been on the rise since 2015, and during the Trump administration, has steadily increased from 2.16% to 2.35%. The financial crisis in 2008 was preceded by a spike in consumer delinquency to over 3%, and continued to rise throughout the recession.
While this level of debt is not a clear indicator of trouble yet, rising delinquencies indicate that consumers have less wiggle room if there is any sort of economic downturn. In that regard, both the government debt and consumer debt figures have something in common–they are stimulating the economy with borrowed money, and they both have left the debt holders with fewer options to combat economic headwinds when they arrive.
3. Economic Indicators Dropping
It’s too early to be sure if we’re seeing a trend here or just a temporary dip. But there has been a lot of news about slowdowns coming out late in the summer. From consumer sentiment, to manufacturing sector, to business investment data, the metrics have taken a hit in recent reports. Manufacturing contracted in August for the first time since 2016. The leading measure of consumer sentiment (University of Michigan) fell sharply in August, landing below 90.0 for the first time in the Trump presidency. Business Investment fell in 2019’s second quarter after three quarters of expansion.
These are the types of leading indicators that cause a lot of hand-wringing about possible recessions. Currently, Trump is claiming that the media is exaggerating the risk of recession to defeat him, but the numbers that often foretell recessions are real. These numbers, in particular, are noteworthy because the Trump tax cuts were supposed to lead to a sustained surge in business investment; the tax cuts, trade war, and regulatory drawbacks in the administrative state are meant to have a sustained impact on manufacturing growth; and low unemployment and projected wage increases (again after the tax cuts) were supposed to keep consumer sentiment higher. These are central measures to Trump’s theory of economic improvement under his presidency, and they aren’t showing the sustained improvements many expected or the public was promised.
4. The Trade War
As stated earlier, when attributing credit or blame, it’s important to point to specific actions by an administration related to economic indicators. And in all of the above indexes, one major reason for declines is the lingering trade war, which is entirely of Trump’s own doing. While the thought process behind the trade disputes will be analyzed in Part Two, the current economic impacts are undeniably bad for the U.S. economy.
In addition to creating uncertainty which drives out incentives for business investment, multiple studies have been done showing that the tariffs are being paid by U.S. consumers; multiple studies have been done indicating that the impacts of the trade war have shaved growth out of both the U.S. and the Chinese economy. So while talk of a “global economic slowdown” leading to a U.S. slowdown often is meant to alleviate blame from our own domestic policies (and certainly there are many factors beyond our control), doing intentional damage to the world’s two biggest economies contributes in large part to that global slowdown.
Further, the impacts are being felt more acutely by some smaller, important segments of the population. The August Agricultural Economic Barometer report (from Purdue University) indicated that nearly 30% of farmers surveyed believe that the $16 billion in agricultural government aid for 2019 will “not at all” make up for the impacts of the trade war, and 58% of farmers surveyed believe that additional aid packages will be needed again for 2020. The Agricultural Economic Barometer was another indicator that dropped sharply in August, but it’s in a different category, as it seems to have spiked in July, so a dropoff is expected.
5. Revisions
The monthly jobs report that came out on September 6th, 2019 revised down last month’s job growth by 15,000 jobs from what was originally reported, and the previous month an additional 5,000 jobs. The downward revision of 20,000 jobs is a relatively small thing, and perfectly within the routine adjustment range. But it takes on some significance when the revisions take on a negative trend. The jobs report was but the latest example of revisions moving the economic needle to worse-than-originally-reported numbers.
- On August 29th, Commerce released a second estimate for 2019 Q2 GDP, lowering the advanced estimate by 0.1% to 2.0%.
- On May 30th, Commerce released a second estimate for the 2019 Q1 GDP, lowered the advance estimate by 0.1% to 3.1%.
- On July 26th, Commerce announced an annual revision of 2018 annual GDP growth from 3.0% to 2.9%.
- In March, the Bureau of Labor Statistics published benchmark revisions to jobs data, indicating that the economy had gained 501,000 fewer jobs than initially reported over the previous year.
The cumulative interpretation of this steady flow of downward revisions is that the economy has been consistently slightly slower than is being reported at a given time. It doesn’t mean that trend will continue, but it definitely raises eyebrows.
Conclusion
This was a pretty long read, and I apologize for that. However, I wanted to be as thorough and well-sourced as possible, while also keeping it fairly basic and straightforward in regards to which economic indicators I used. These aren’t cherry-picked numbers; they’re the top-line, oft-reported economic fundamental metrics, from their primary sources. Again, the goal of this was twofold:
- To prove objectively that the economy is good, not great or historic. This removes from conversation the notion that the economy is good enough (or different enough from the Obama years) to justify absolving Trump of his greater flaws, which will be detailed in Parts Two and Three.
- To show real, tangible signs in the economy that a slowdown is looming, and that various strategies employed by the Trump administration to boost the economy have been ineffective or detrimental.
If we can accept the realities presented in this writing, then moving forward with Parts Two and Three will be that much more meaningful. Part Two will focus on Trump’s campaign promises and his inability to adequately address the problems he outlined throughout his campaign. Part Three will focus on some more intangible factors of Trump’s presidency that point to weaknesses in his leadership and management tasks, rooted in evidence.
